Example: Generating PPTX Report for Grad-CAM Results
The code below is used to generate the PowerPoint report for the Grad-CAM
results using the XAI.report_generation.generate_pptx() function.
This code is to be run after the Grad-CAM has been performed on the desired images. Refer to Example: Doing Grad-CAM on the Food-Non-Food (FNF) model and Example: Doing Grad-CAM on the Food Scoring (FS) model for example codes on how to perform Grad-CAM for Food-Non-Food (FNF) and Food Scoring (FS) models.
1 2 3 4 5 6 7 8 | import XAI
XAI.report_generation.generate_pptx(
fnf_or_fs="fnf",
gradcam_csv_path="/path/to/gradcam_metadata.csv",
pptx_template_path="/path/to/Holmusk_XAI_Template.pptx",
output_folder="/output_folder",
)
|
Expected output
The expected output of the XAI.report_generation.generate_pptx() function
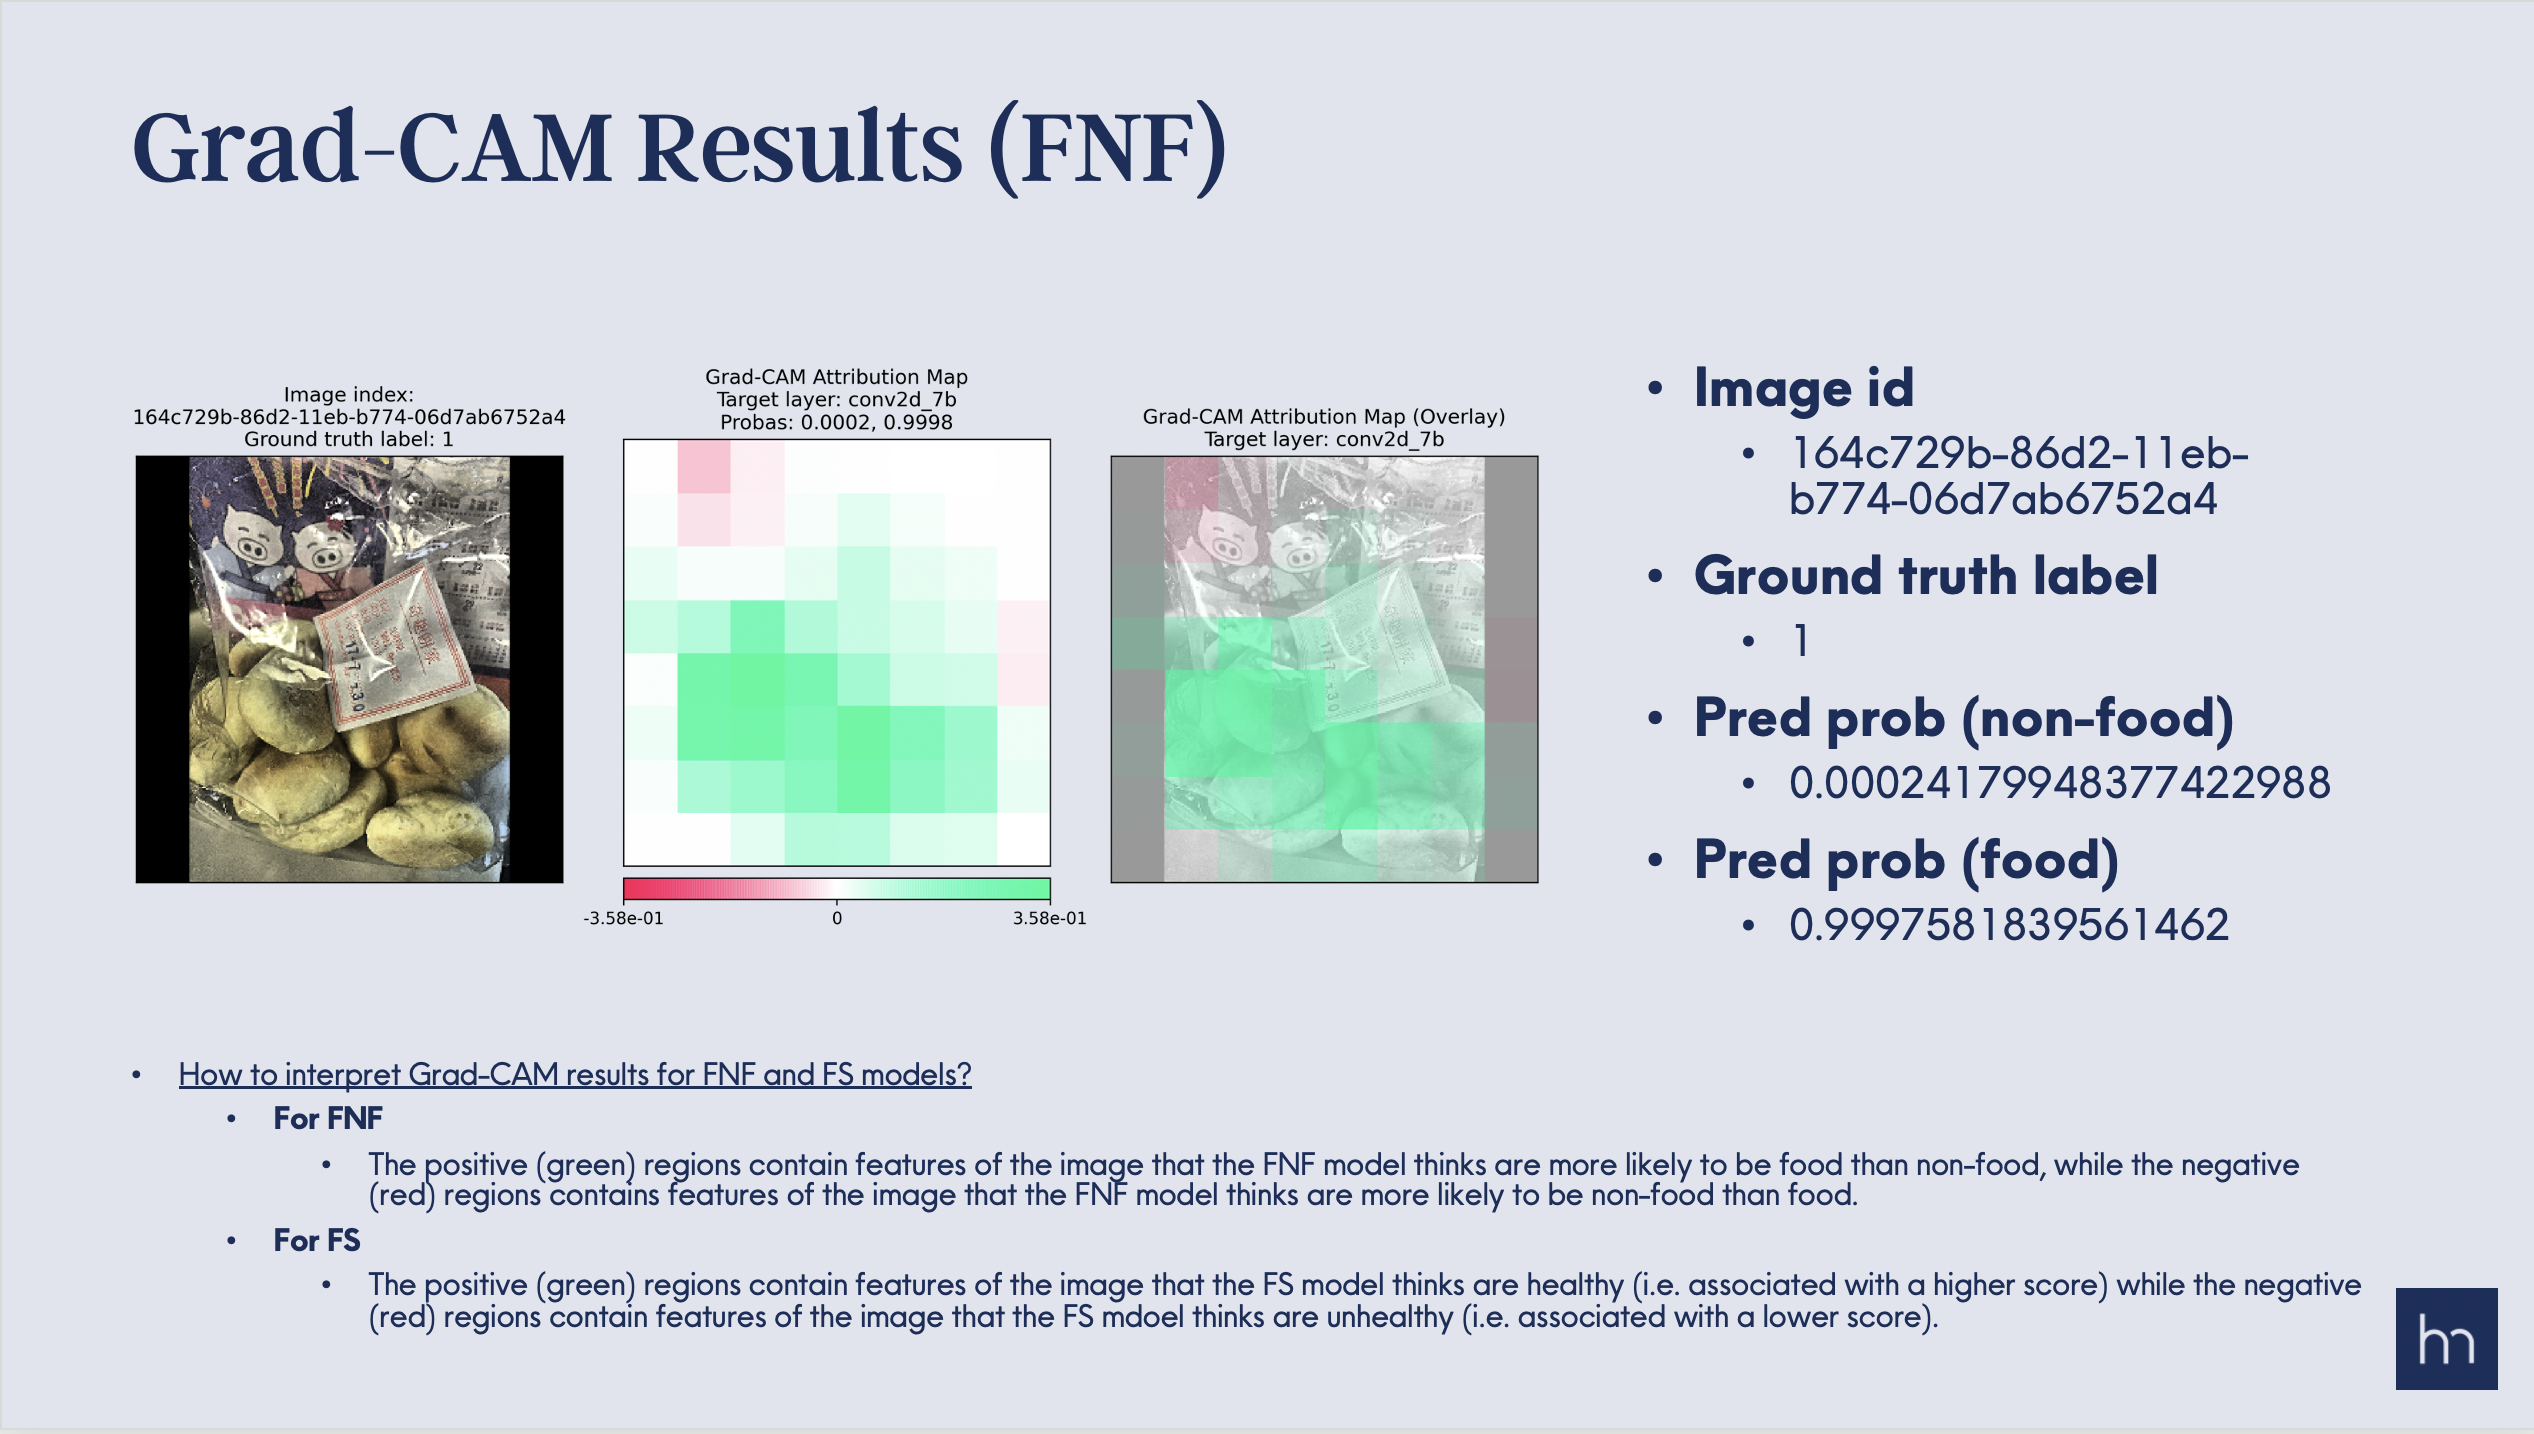
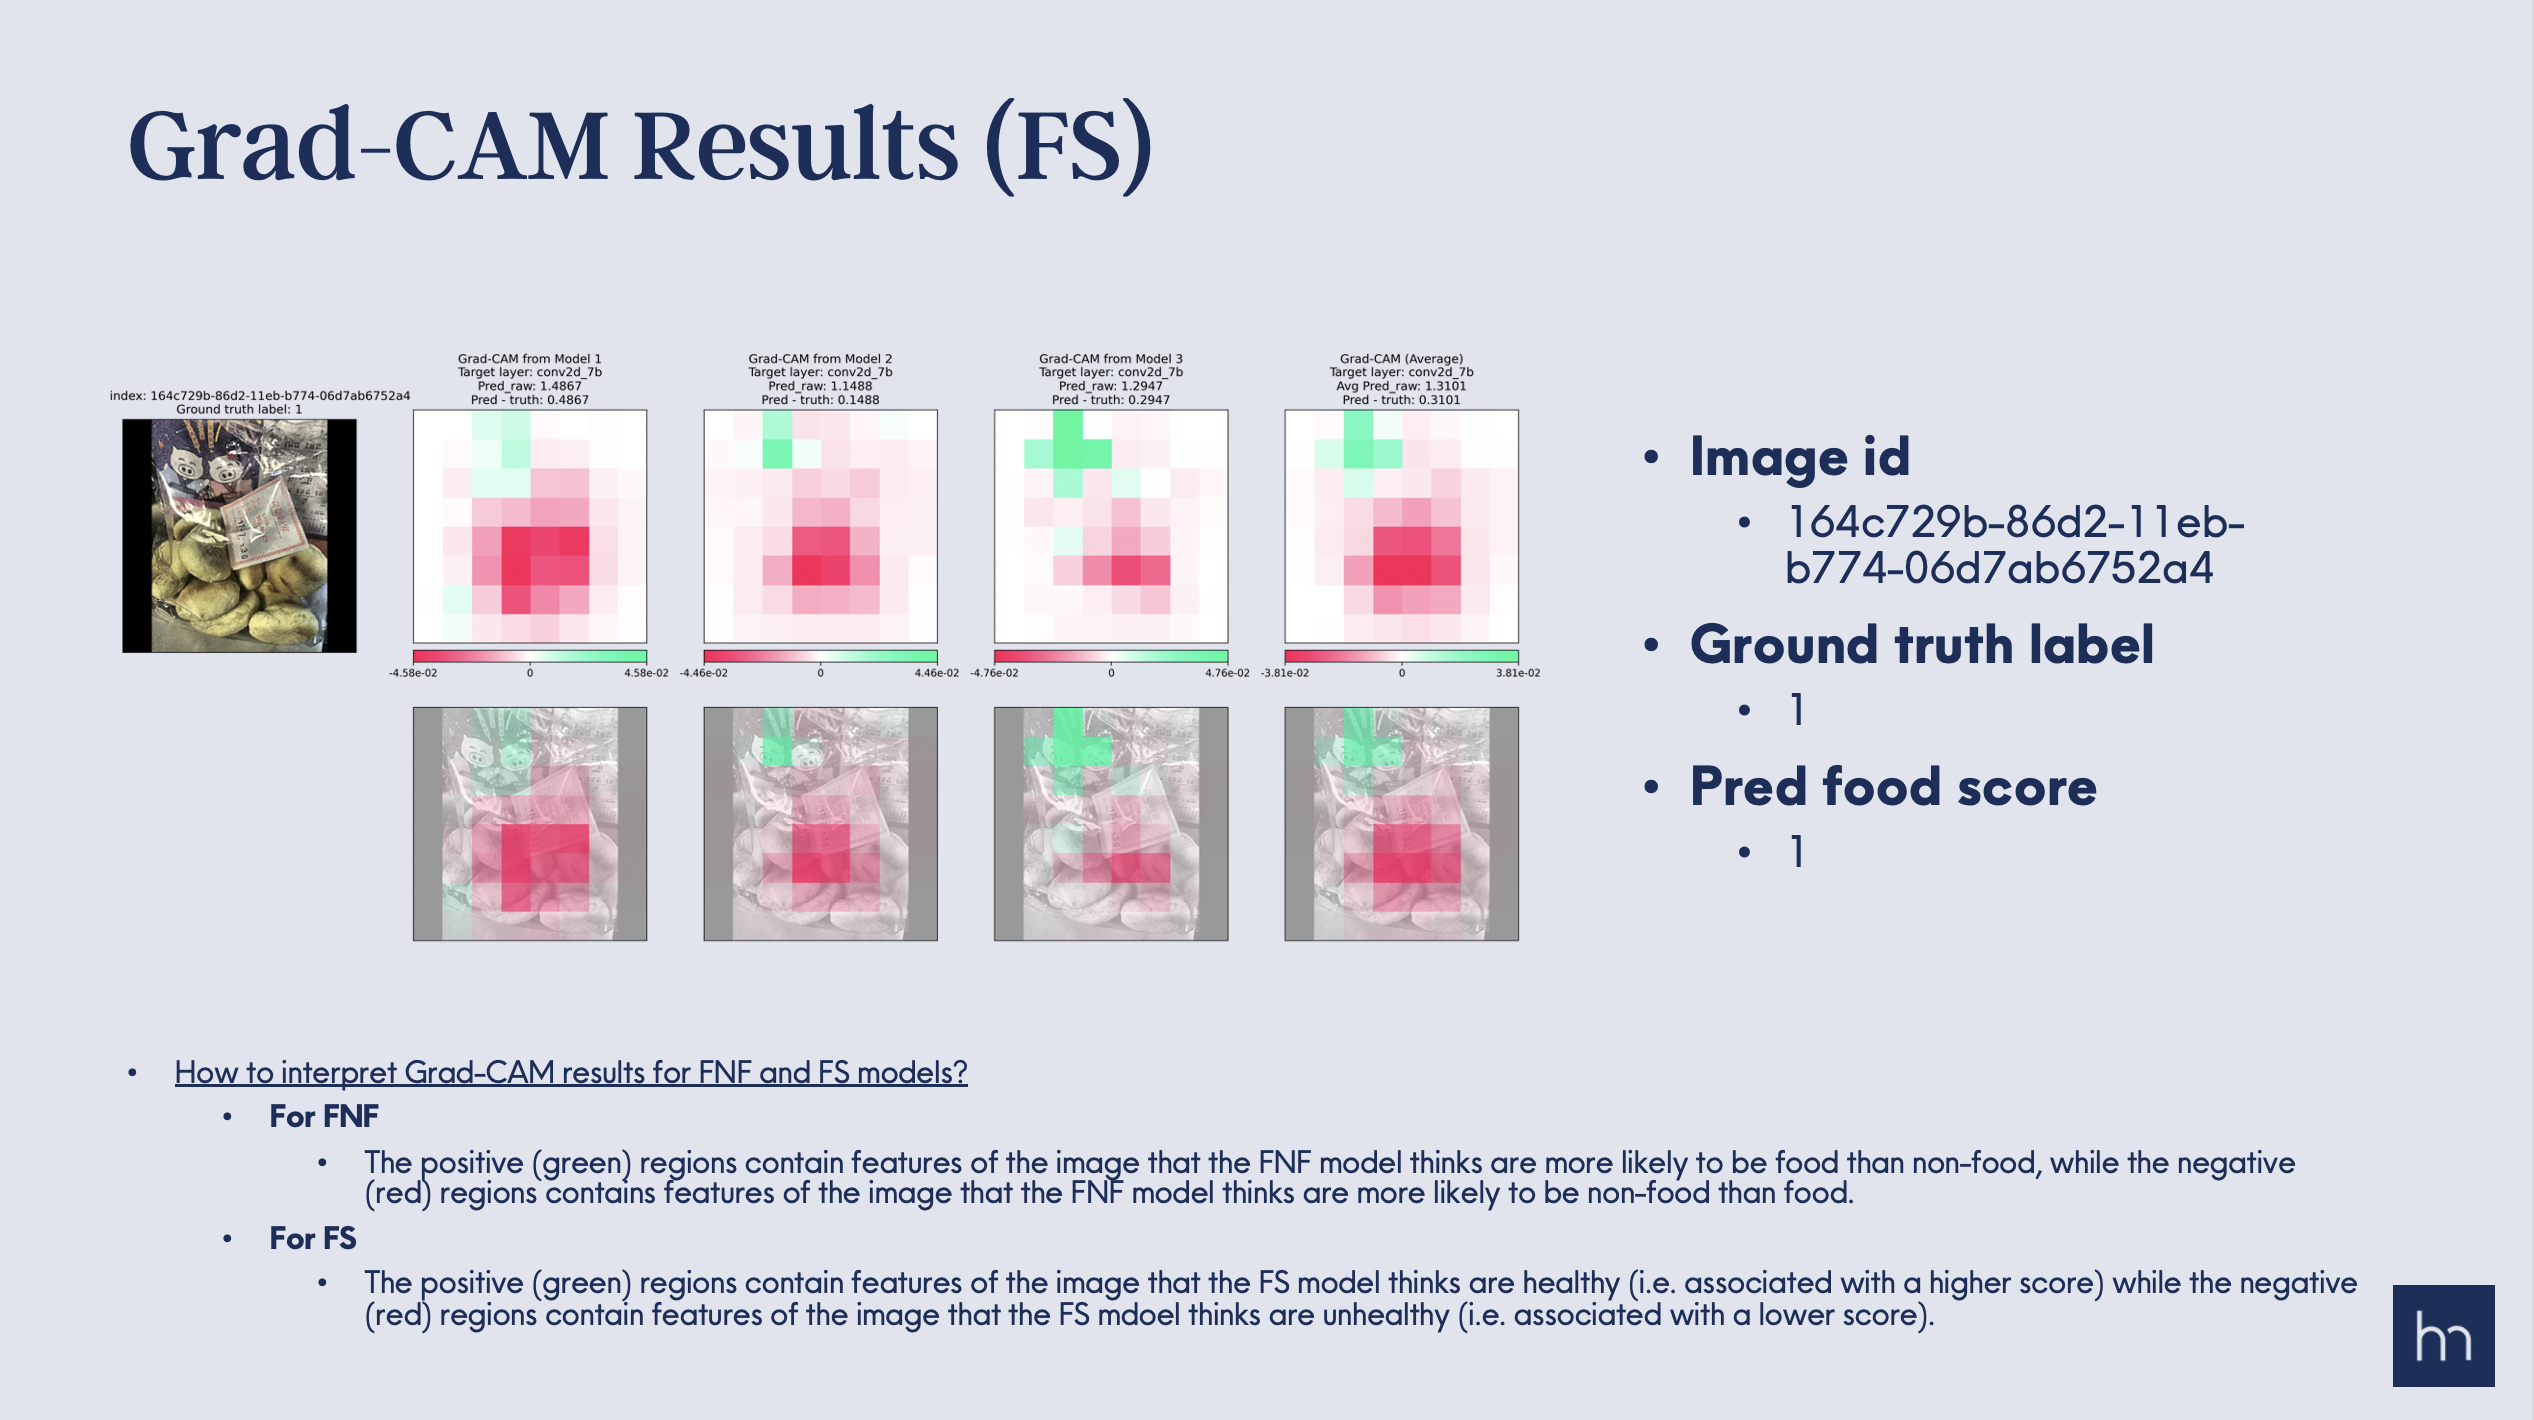
is a PowerPoint report. The report contains slides like the following:
For FNF:
For FS:
This PowerPoint report will be saved in the following folder structure:
# For FNF report.
    output_folder/
        └── powerpoint_report/
            └── GradCAM_Results_FNF.pptx

# For FS report.
output_folder/
    └── powerpoint_report/
        └── GradCAM_Results_FS.pptx
If the output_folder specified is the same as the output_folder in
do_gradcam() and/or plot_gradcam() functions, then the resulting
folder structure will be:
output_folder/
    ├── gradcam_metadata.csv
    ├── gradcam_numpy_arrays/
    │   ├── image_id_1.npy
    │   ├── image_id_2.npy
    │   ├── ...
    │   └── image_id_N.npy
    ├── gradcam_plots/
    │   ├── image_id_1.png
    │   ├── image_id_2.png
    │   ├── ...
    │   └── image_id_N.png
    └── powerpoint_report/ <--- Additional folder for PPTX report.
        └── GradCAM_Results_<FNF_or_FS>.pptx